


Page 34 - ANP_Rapport annuel 2024_Ang_WEB
P. 34
2024
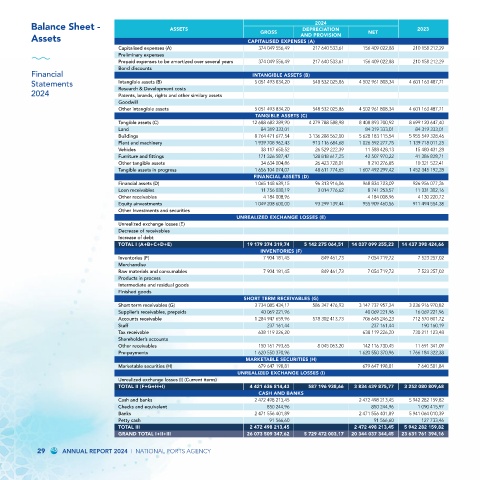
          Balance Sheet -                      ASSETS                              DEPRECIATION                   2023
                                                                        GROSS      AND PROVISION     NET
          Assets                                                    CAPITALISED EXPENSES (A)
                                 Capitalised expenses (A)               374 049 556,49        217 640 533,61        156 409 022,88        210 158 212,29
                                 Preliminary expenses
                                 Prepaid expenses to be amortized over several years   374 049 556,49        217 640 533,61        156 409 022,88        210 158 212,29
                                 Bond discounts
          Financial                                                   INTANGIBLE ASSETS (B)
          Statements             Intangible assets (B)                5 051 493 834,20  548 532 025,86  4 502 961 808,34  4 601 163 487,71
                                 Research & Development costs
          2024                   Patents, brands, rights and other similary assets
                                 Goodwill
                                 Other intangible assets               5 051 493 834,20        548 532 025,86        4 502 961 808,34       4 601 163 487,71
                                                                      TANGIBLE ASSETS (C)
                                 Tangible assets (C)                  12 688 682 289,90        4 279 788 588,98        8 408 893 700,92        8 699 120 647,40
                                 Land                                    84 319 333,01               84 319 333,01       84 319 333,01
                                 Buildings                             8 764 471 677,54        3 136 288 562,00        5 628 183 115,54       5 955 549 328,46
                                 Plant and machinery                   1 939 708 962,43        913 116 684,68        1 026 592 277,75       1 139 718 011,25
                                 Vehicles                                38 117 650,52        26 529 222,39        11 588 428,13       15 480 431,28
                                 Furniture and fittings                 171 326 587,47        128 818 617,25        42 507 970,22       41 386 828,71
                                 Other tangible assets                   34 634 004,86        26 423 728,01        8 210 276,85       10 321 522,41
                                 Tangible assets in progress           1 656 104 074,07        48 611 774,65        1 607 492 299,42       1 452 345 192,28
                                                                      FINANCIAL ASSETS (D)
                                 Financial assets (D)                  1 065 148 639,15        96 313 916,06        968 834 723,09        926 956 077,26
                                 Loan receivables                        11 756 030,19        3 014 776,62        8 741 253,57        11 331 302,16
                                 Other receivables                       4 184 008,96                 4 184 008,96        4 130 220,72
                                 Equity ainvestments                   1 049 208 600,00        93 299 139,44        955 909 460,56        911 494 554,38
                                 Other Investments and securities
                                                                 UNREALIZED EXCHANGE LOSSES (E)
                                 Unrealized exchange losses (E)
                                 Decrease of receivables
                                 Increase of debt
                                 TOTAL I (A+B+C+D+E)                 19 179 374 319,74        5 142 275 064,51        14 037 099 255,23        14 437 398 424,66
                                                                        INVENTORIES (F)
                                 Inventories (F)                         7 904 181,45        849 461,73        7 054 719,72        7 523 257,02
                                 Merchandise
                                 Raw materials and consumables           7 904 181,45        849 461,73        7 054 719,72        7 523 257,02
                                 Products in process
                                 Intermediate and residual goods
                                 Finished goods
                                                                   SHORT TERM RECEIVABLES (G)
                                 Short term receivables (G)            3 734 085 434,17        586 347 476,93        3 147 737 957,24       3 236 916 970,82
                                 Supplier’s receivables, prepaids        40 069 221,96               40 069 221,96       16 069 221,96
                                 Accounts receivable                   1 284 947 659,96        578 302 413,73        706 645 246,23       712 570 801,72
                                 Staff                                    237 161,44                   237 161,44       190 160,19
                                 Tax receivable                         638 119 226,20              638 119 226,20       730 211 123,48
                                 Shareholder’s accounts
                                 Other receivables                      150 161 793,65        8 045 063,20        142 116 730,45        11 691 341,09
                                 Pre-payments                          1 620 550 370,96            1 620 550 370,96        1 766 184 322,38
                                                                    MARKETABLE SECURITIES (H)
                                 Marketable securities (H)              679 647 198,81              679 647 198,81       7 640 581,84
                                                                 UNREALIZED EXCHANGE LOSSES (I)
                                 Unrealized exchange losses (I) (Current items)
                                 TOTAL II (F+G+H+I)                  4 421 636 814,43        587 196 938,66        3 834 439 875,77        3 252 080 809,68
                                                                       CASH AND BANKS
                                 Cash and banks                        2 472 498 213,45            2 472 498 213,45        5 942 282 159,82
                                 Checks and equivalent                    850 244,96                   850 244,96      1 090 415,97
                                 Banks                                 2 471 556 401,89            2 471 556 401,89       5 941 064 010,39
                                 Petty cash                                91 566,60                   91 566,60     127 733,46
                                 TOTAL III                           2 472 498 213,45             2 472 498 213,45        5 942 282 159,82
                                 GRAND TOTAL I+II+III                26 073 509 347,62        5 729 472 003,17        20 344 037 344,45        23 631 761 394,16

           29     ANNUAL REPORT 2024  I  NATIONAL PORTS AGENCY

