
Page 28 - ANP_Rapport annuel 2024_Ang_WEB
P. 28
PORT ACTIVITY
IN 2024
The year 2024 marked a sustained recovery in national port activity, with traffic levels among the highest of the past five years.
This performance was driven by the growth of phosphate and derivative exports, as well as increased imports of strategic raw
materials such as cereals and hydrocarbons. Cabotage traffic remained concentrated at the ports of Jorf Lasfar, Casablanca,
and Agadir.
Supported by the revival of international trade and the This momentum was accompanied by greater attractiveness
implementation of structuring projects, the growth in flows of the port domain, illustrated by a 9% increase in concessions,
handled by Moroccan ports confirmed their resilience. In an 18% rise in activity authorizations, and the granting of
2024, total trade volume reached 100 million tons, exceeding 411 new Temporary Occupancy of Public Domain (TOPD)
the annual average of 89.42 million tons recorded between permits. These developments reflect operators’ confidence
2019 and 2023. Monthly traffic analysis highlights a steady in the growth potential of ANP-managed ports and confirm
recovery throughout the year, with sharp increases observed the relevance of the Agency’s business model, with 46% of
in April, May, and July. Operational indicators also confirmed revenue derived from its port regulatory functions.
significant progress: reduced waiting times, improved cargo-
handling productivity, and optimized processing of grain, oil,
phosphate, and container vessels.
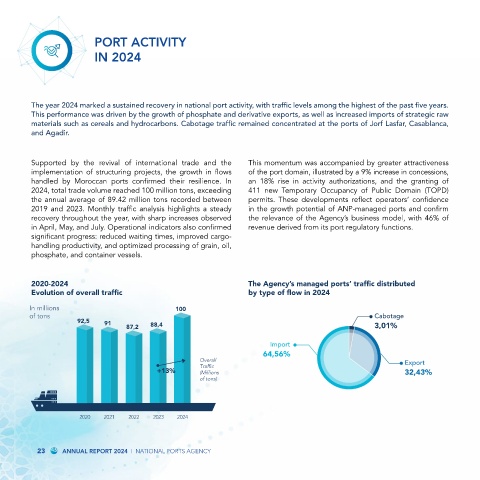
2020-2024 The Agency’s managed ports’ traffic distributed
Evolution of overall traffic by type of flow in 2024
In millions 100
of tons Cabotage
92,5
91 88,4
87,2 3,01%
Import
64,56%
Overall Export
Traffic
+13% (Millions 32,43%
of tons)
2020 2021 2022 2023 2024
23 ANNUAL REPORT 2024 I NATIONAL PORTS AGENCY