
Page 35 - Rapport annuel 2022 ANG
P. 35
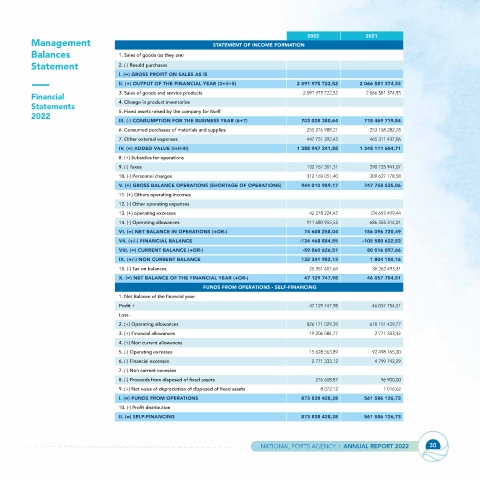
-                             2022           2021
          Management                                       STATEMENT OF INCOME FORMATION
          Balances               1. Sales of goods (as they are)
          Statement              2. (-) Resold purchases
                                 I. (=) GROSS PROFIT ON SALES AS IS
                                 II. (+) OUTPUT OF THE FINANCIAL YEAR (3+4+5)     2 091 975 722,52        2 066 581 374,55
                                 3. Sales of goods and service products             2 091 975 722,52        2 066 581 374,55
          Financial
                                 4. Change in product inventories
          Statements
                                 5. Fixed assets raised by the company for itself
          2022
                                 III. (-) CONSUMPTION FOR THE BUSINESS YEAR (6+7)   703 028 380,64        718 469 719,84
                                 6. Consumed purchases of materials and supplies     255 276 988,21        253 158 282,78
                                 7. Other external expenses                          447 751 392,43        465 311 437,06
                                 IV. (=) ADDED VALUE (I+II-III)                   1 388 947 341,88        1 348 111 654,71
                                 8. (+) Subsidies for operations
                                 9. (-) Taxes                                        132 767 301,31        290 725 941,07
                                 10. (-) Personnel charges                           312 169 051,40        309 627 178,58
                                 V. (=) GROSS BALANCE OPERATIONS (SHORTAGE OF OPERATIONS)   944 010 989,17        747 758 535,06
                                 11. (+) Others operating incomes
                                 12. (-) Other operating expenses
                                 13. (+) operating excesses                           42 278 224,42        124 693 499,44
                                 14. (-) Operating allowances                        911 680 955,55        686 355 314,01
                                 VI. (=) NET BALANCE IN OPERATIONS (+OR-)           74 608 258,04       186 096 720,49
                                 VII. (+/-) FINANCIAL BALANCE                     -134 468 884,55   -105 580 622,83
                                 VIII. (=) CURRENT BALANCE (+OR-)                  -59 860 626,51      80 516 097,66
                                 IX. (+/-) NON CURRENT BALANCE                     132 341 982,13        1 804 150,16
                                 15. (-) Tax on balances                              25 351 607,64        36 262 493,31
                                 X. (=) NET BALANCE OF THE FINANCIAL YEAR (+OR-)    47 129 747,98       46 057 754,51
                                                        FUNDS FROM OPERATIONS - SELF-FINANCING
                                 1. Net Balance of the financial year:
                                 Profit +                                             47 129 747,98        46 057 754,51
                                 Loss -
                                 2. (+) Operating allowances                         826 171 029,39        610 151 429,77
                                 3. (+) Financial allowances                          19 206 084,77        2 771 333,12
                                 4. (+) Non current allowances
                                 5. (-) Operating excesses                            15 628 563,89        92 498 765,00
                                 6. (-) Financial excesses                            2 771 333,12        4 799 742,29
                                 7. (-) Non current excesses
                                 8. (-) Proceeds from disposed of fixed assets         276 608,87        96 900,00
                                 9. (+) Net valus of depreciation of disposed of fixed assets   8 072,12      1 016,62
                                 I. (=) FUNDS FROM OPERATIONS                      873 838 428,38        561 586 126,73
                                 10. (-) Profit distribution
                                 II. (=) SELF-FINANCING                            873 838 428,38        561 586 126,73


                                                                        NATIONAL PORTS AGENCY  I  ANNUAL REPORT 2022  30