
Page 32 - Rapport annuel 2022 ANG
P. 32
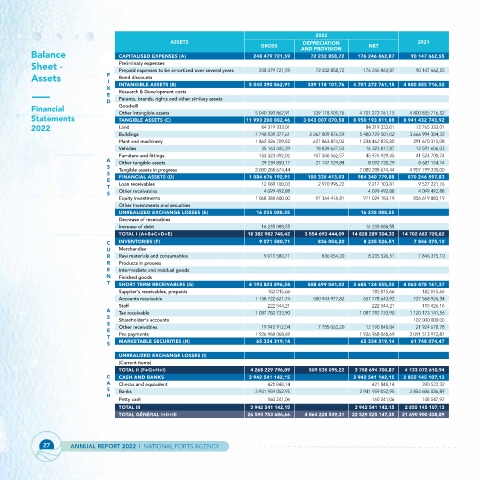
2022
                                               ASSETS                              DEPRECIATION                    2021
                                                                        GROSS                        NET
                                                                                   AND PROVISION
          Balance                CAPITALISED EXPENSES (A)             248 479 721,59        72 232 858,72        176 246 862,87        90 147 662,55
          Sheet -                Preliminary expenses
                                 Prepaid expenses to be amortized over several years   248 479 721,59        72 232 858,72        176 246 862,87        90 147 662,55
          Assets              F I  Bond discounts
                                 INTANGIBLE ASSETS (B)               5 040 390 862,91        339 118 101,76        4 701 272 761,15        4 800 855 716,52
                              X
                                 Research & Development costs
                              E
                                 Patents, brands, rights and other similary assets
                              D
                                 Goodwill
          Financial
                                 Other intangible assets               5 040 390 862,91        339 118 101,76        4 701 272 761,15        4 800 855 716,52
          Statements             TANGIBLE ASSETS (C)                11 993 200 882,46        3 043 007 070,58        8 950 193 811,88        8 941 432 743,92
          2022                   Land                                    84 319 333,01               84 319 333,01        12 765 333,01
                                 Buildings                             7 748 539 377,61        2 267 809 876,59        5 480 729 501,02        3 666 994 304,32
                                 Plant and machinery                   1 862 326 709,82        627 863 874,02        1 234 462 835,80        291 670 315,08
                                 Vehicles                                35 163 445,39        18 839 627,52        16 323 817,87        12 591 606,03
                                 Furniture and fittings                 153 323 492,02        107 346 562,57        45 976 929,45        41 524 700,74
                              A
                                 Other tangible assets                   29 239 850,17        21 147 129,88        8 092 720,29        8 687 154,74
                              S
                                 Tangible assets in progress           2 080 288 674,44            2 080 288 674,44        4 907 199 330,00
                              S
                                 FINANCIAL ASSETS (D)                1 084 676 192,91        100 335 413,03        984 340 779,88        870 246 597,83
                              E
                                 Loan receivables                        12 188 100,03        2 970 996,22        9 217 103,81        9 527 221,76
                              T
                                 Other receivables                       4 099 492,88                 4 099 492,88        4 099 492,88
                              S
                                 Equity investments                    1 068 388 600,00        97 364 416,81        971 024 183,19        856 619 883,19
                                 Other Investments and securities
                                 UNREALIZED EXCHANGE LOSSES (E)        16 235 088,55                16 235 088,55
                                 Decrease of receivables
                                 Increase of debt                        16 235 088,55               16 235 088,55
                                 TOTAL I (A+B+C+D+E)                 18 382 982 748,42        3 554 693 444,09        14 828 289 304,33        14 702 682 720,82
                              C  INVENTORIES (F)                        9 071 580,71       836 054,20      8 235 526,51        7 846 375,10
                              U  Merchandise
                              R  Raw materials and consumables           9 071 580,71        836 054,20      8 235 526,51        7 846 375,10
                              R  Products in process
                              E  Intermediate and residual goods
                              N  Finished goods
                              T  SHORT TERM RECEIVABLES (G)          4 193 823 896,24        508 699 041,02        3 685 124 855,22        4 063 478 161,37
                                 Supplier's receivables, prepaids         182 015,66                   182 015,66      182 015,66
                                 Accounts receivable                   1 158 722 621,74        500 943 977,82        657 778 643,92        727 568 926,34
                                 Staff                                    222 544,21                   222 544,21      115 426,16
                              A
                                 Tax receivable                        1 087 782 733,90            1 087 782 733,90        1 120 173 141,56
                              S
                                 Shareholder's accounts                                                           102 000 000,00
                              S
                                 Other receivables                       19 945 912,04        7 755 063,20        12 190 848,84        21 924 678,78
                              E
                                 Pre-payments                          1 926 968 068,69            1 926 968 068,69        2 091 513 972,87
                              T
                                 MARKETABLE SECURITIES (H)             65 334 319,14                65 334 319,14        61 748 074,47
                              S
                                 UNREALIZED EXCHANGE LOSSES (I)
                                 (Current items)
                                 TOTAL II (F+G+H+I)                   4 268 229 796,09        509 535 095,22        3 758 694 700,87        4 133 072 610,94
                              C  CASH AND BANKS                      3 942 541 142,15             3 942 541 142,15        2 855 145 107,13
                              A  Checks and equivalent                    421 848,14                   421 848,14      390 522,32
                              S
                                 Banks                                 3 941 959 052,95            3 941 959 052,95        2 854 606 036,89
                              H
                                 Petty cash                               160 241,06                   160 241,06      148 547,92
                                 TOTAL III                            3 942 541 142,15            3 942 541 142,15        2 855 145 107,13
                                 TOTAL GÉNÉRAL I+II+III              26 593 753 686,66        4 064 228 539,31        22 529 525 147,35        21 690 900 438,89
             27     ANNUAL REPORT 2022  I  NATIONAL PORTS AGENCY